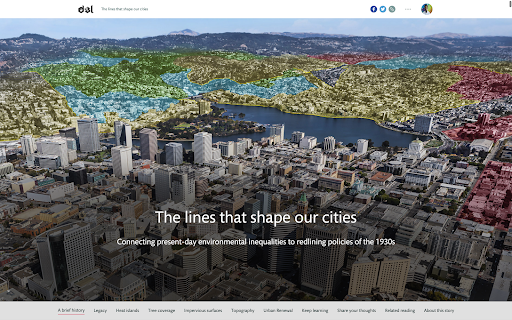
Poems and novels can make us laugh or cry. They show us what other people have experienced and help us imagine new possibilities. Similarly, maps can show real human experiences, make predictions about the future and plan a new tomorrow. We can combine maps with words to create stories that are more clear and convincing. The Lines that Shape Our Cities is a story map that connects environmental inequalities happening today to redlining policies of the 1930s.
Scientists publish their research in articles using sophisticated language to explain what they learned. There is probably an article sharing research results about every topic ever studied using science. Well, maps can be used to show research results in ways we can more easily understand.
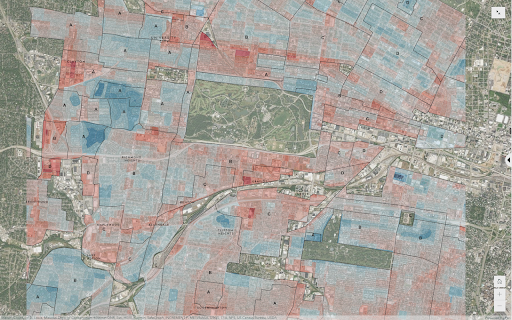
The blue and red map on the right combines research data about the temperature of neighborhoods in St Louis on a summer day in 2019 with Redlining data. It shows that many of the coolest areas (blue areas) on that summer day in 2019 were the areas in the 1930s that were categorized as: A - Best or B - Still Desirable.
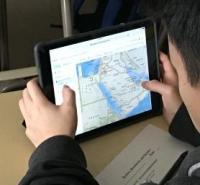
Technologists put what artists, writers and scientists have shared about the world into apps. Tech gives us apps we can use to order food, share our experiences and learn about the world. Apps basically place the world at our fingertips and invite us to experience more. You can also use interactive maps to share stories that guide action on laptops, tablets and smartphones. Maps can help you find the best way to get to your school, work or meet with your friends. Supervisors and managers can also use maps to direct their staff to work sites.