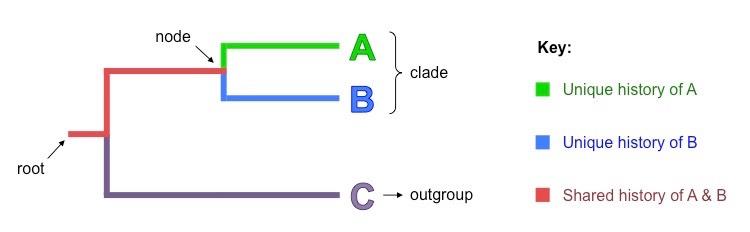
Do you see how certain individuals are close together in the circlular cladogram on the right? I broke down the collection of samples into semi-related families, shown color-coded in the tree. What does this mean in your own words? Can you identify where the lines intersect and root these individuals close together? These intersections are called nodes and represent common ancestors.
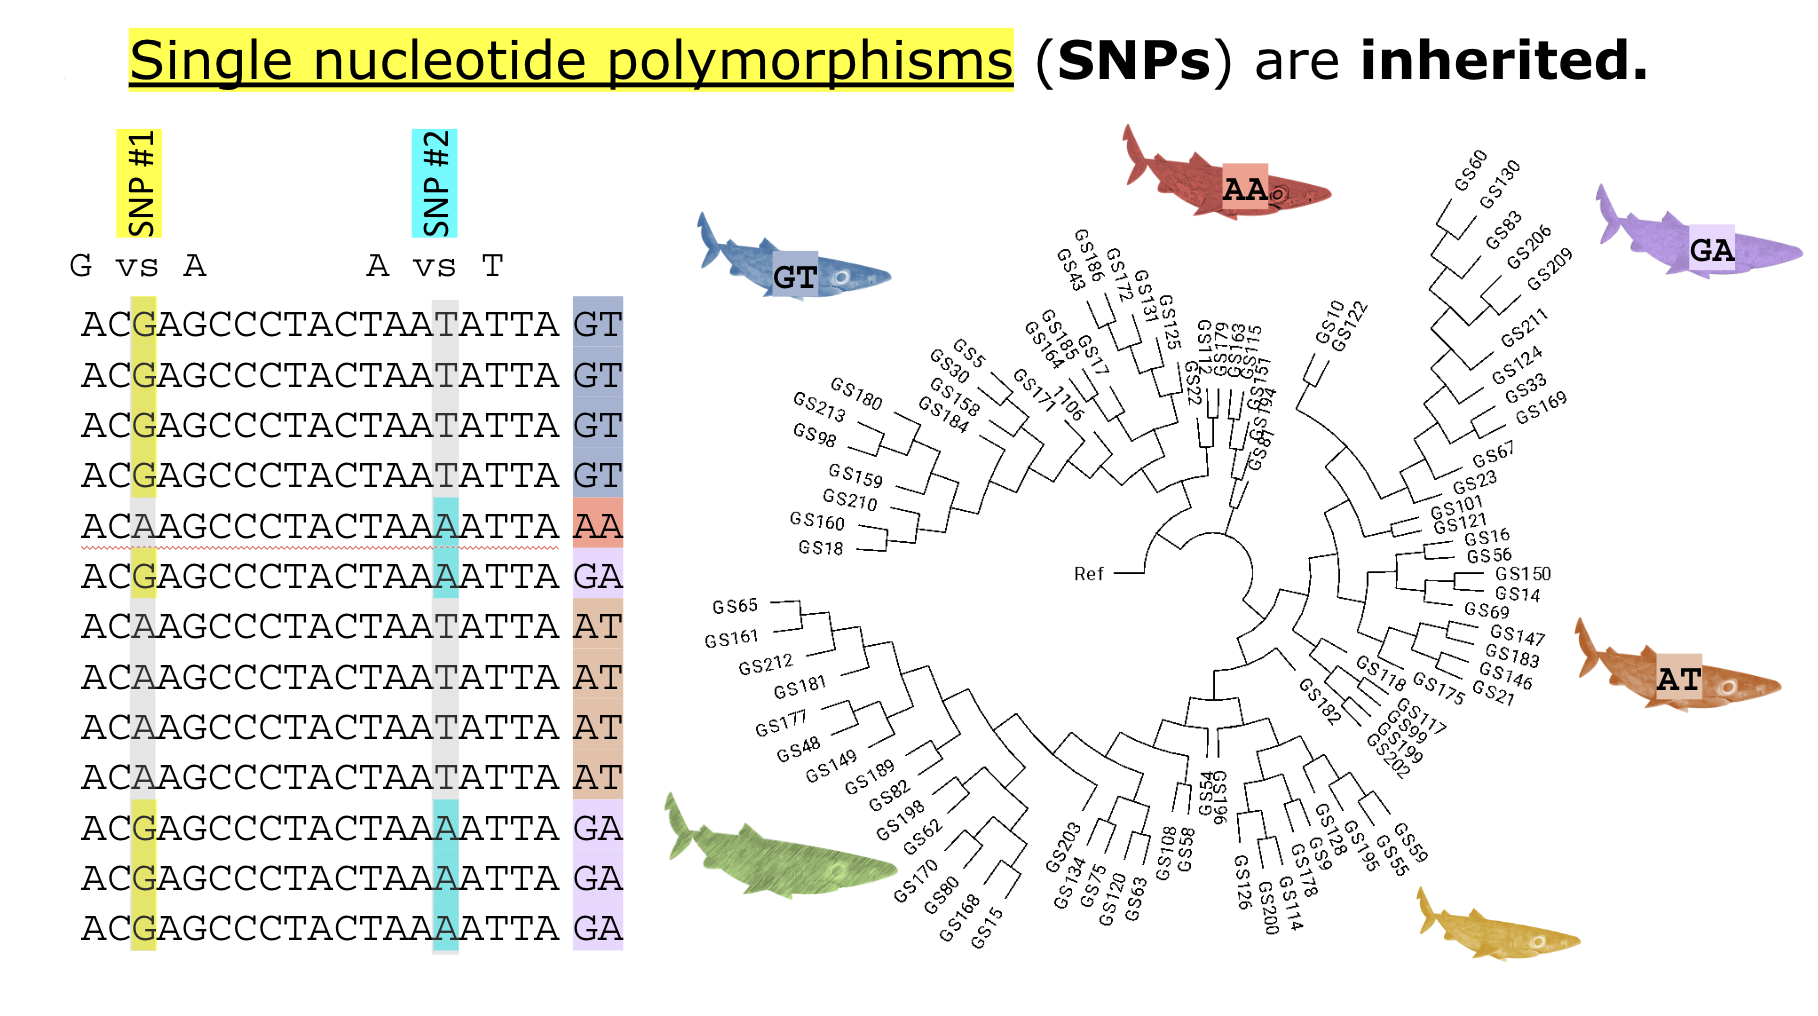
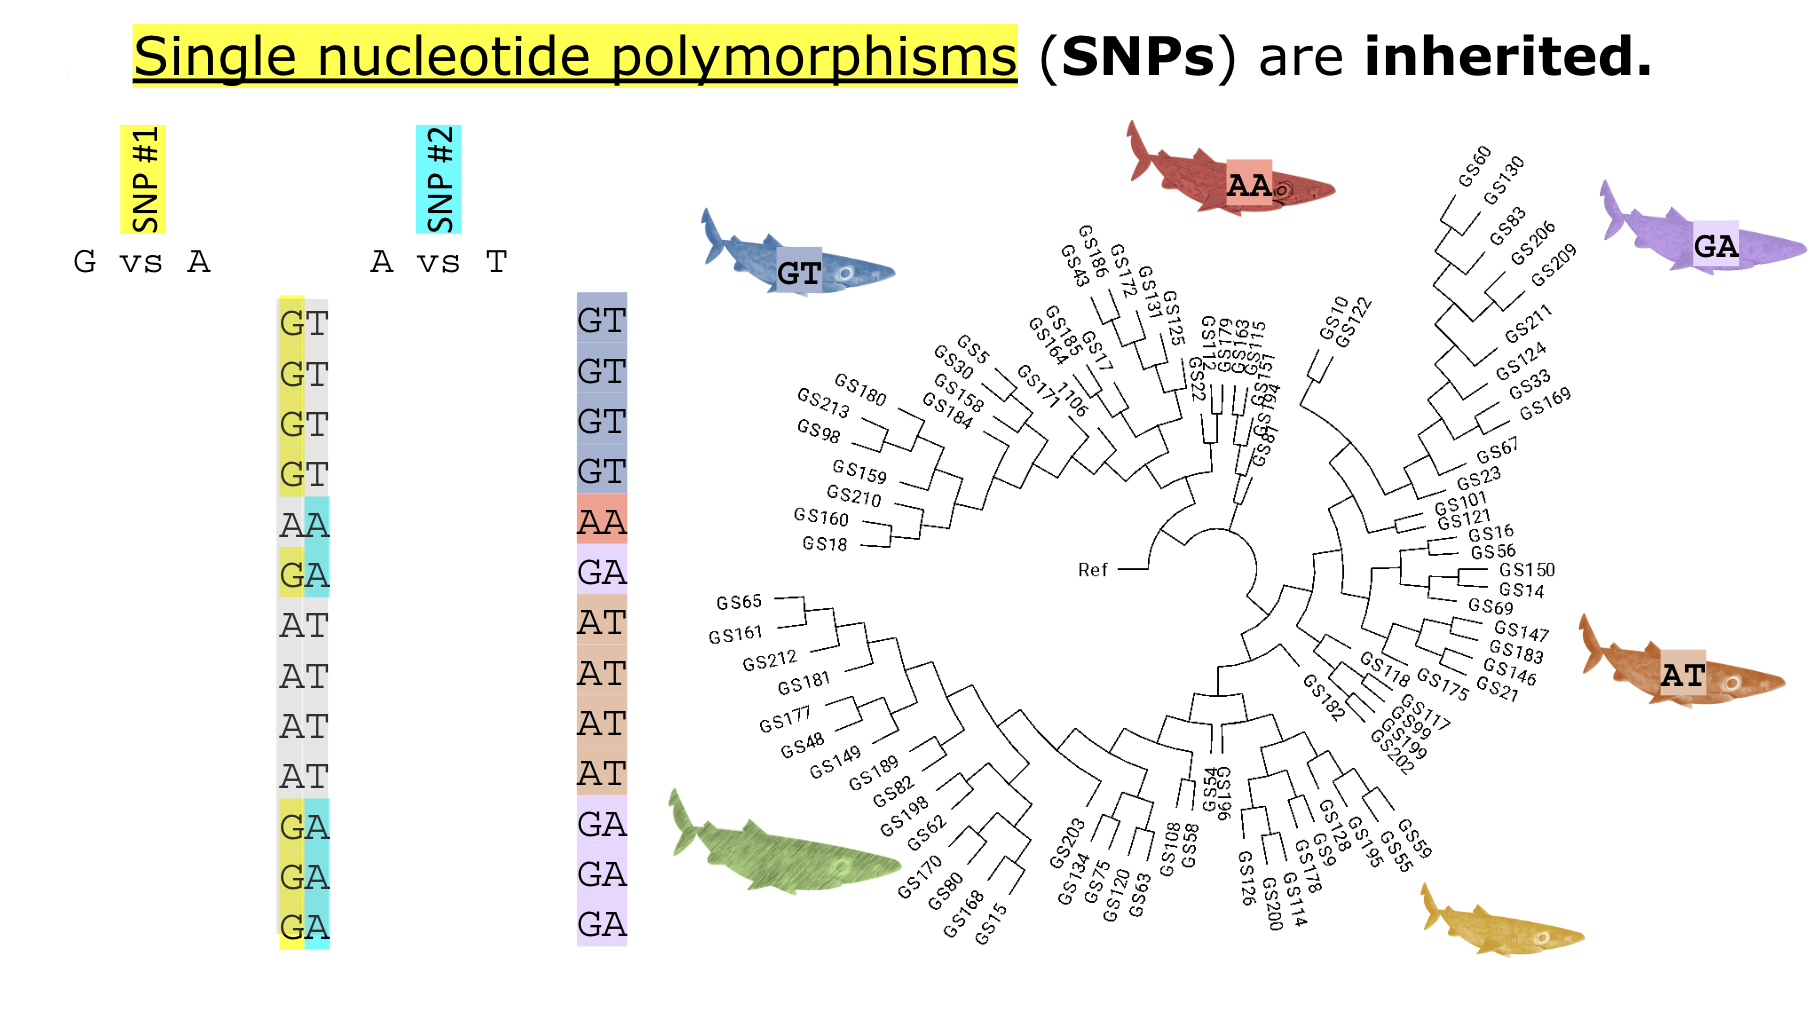
Within that picture, do you see how those two hypothetical SNPs can sort all of those sharks into four different genotypes/groups (GT, AA, GA, AT; BLUE, RED, PURPLE, and ORANGE)? With more sharks sequenced, and with more SNPs identified and included in our experimental panel, we could also know if the GREEN and YELLOW families are present. We aim to gain insight into what individual we have in a water sample and what family they are closely related to, all without ever seeing the animal.
The process of all of this may need to be clarified. What sample am I actually using? For clarity's sake, I included a flow chart detailing my vision of using eDNA for species detection and getting as close to determining individual diversity as possible. I began with a database of multiple shark mtDNA genomes sequenced from tissue samples. This database identified the most telling mutations in this genome, essentially putting a magnifying glass to the most telling regions of the DNA. I now know what DNA to look for in environmental water samples. I can create primer sets to include in our new assay that target specific regions of the Greenland shark mitochondrial genome.