At the end, it shares ways to donate or volunteer. This is a mission-driven map that was able to create a narrative around the topic of a refugee crisis.
I had an opportunity to work with K-12 students through a GeoMentor program. They had a mission to find out if a neighborhood named Old Fourth Ward was experiencing gentrification because they started to see tiny changes in the houses, the people walking around had changed, and access to shopping expanded. Gentrification is a process where poor urban neighborhoods are changed into wealthier neighborhoods. They really wanted to know if the diversity of their nieghborhood was changing and, if so, they wanted to raise awareness about low-income residents being forced out of their homes.
They had a hunch that maps and data would show a dip in the African American population and lower income residents with a rise in home value. To find out if the hunch was correct, they had to take some important steps: 1) Have a question, 2) Find some data, and 3) Make a map.
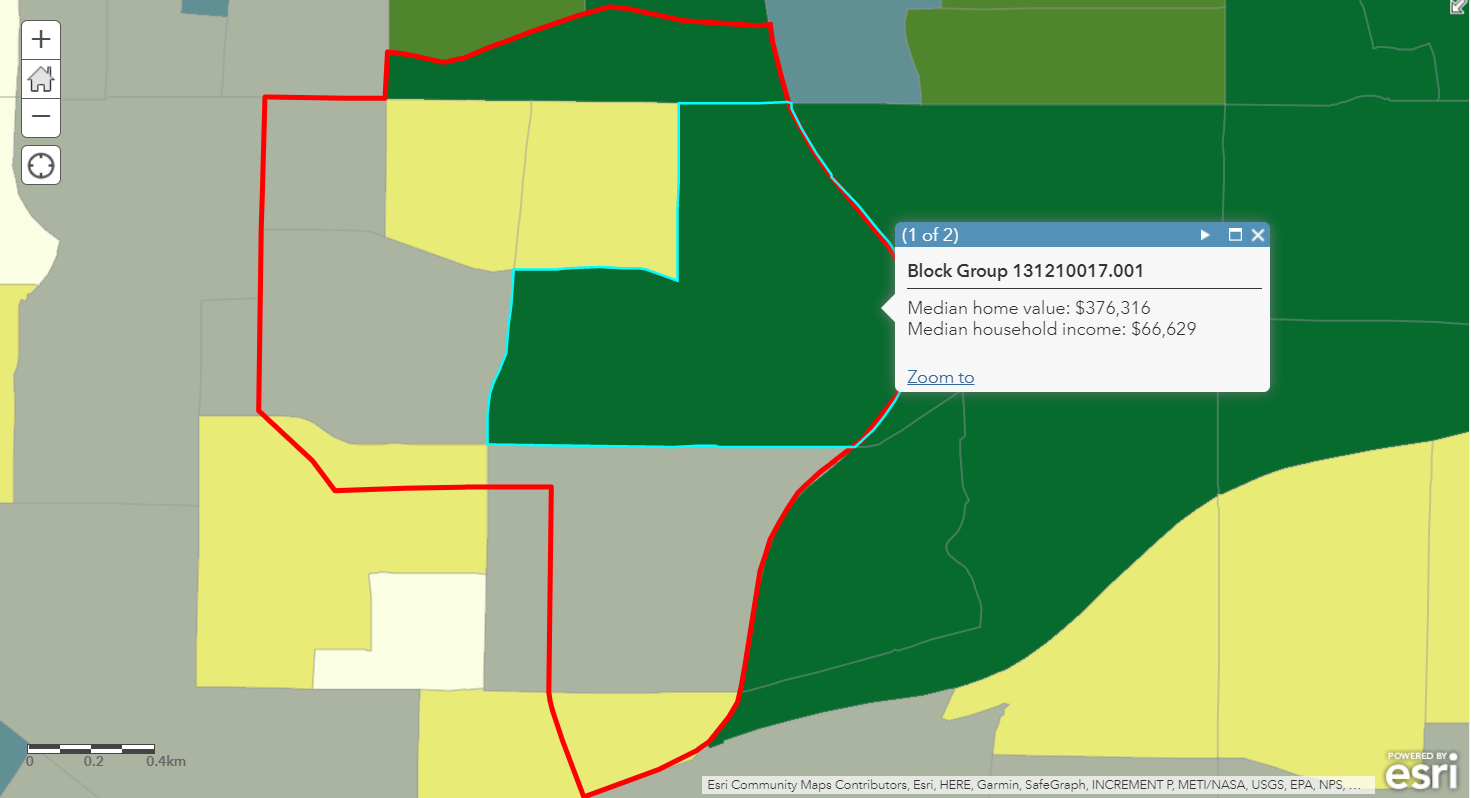
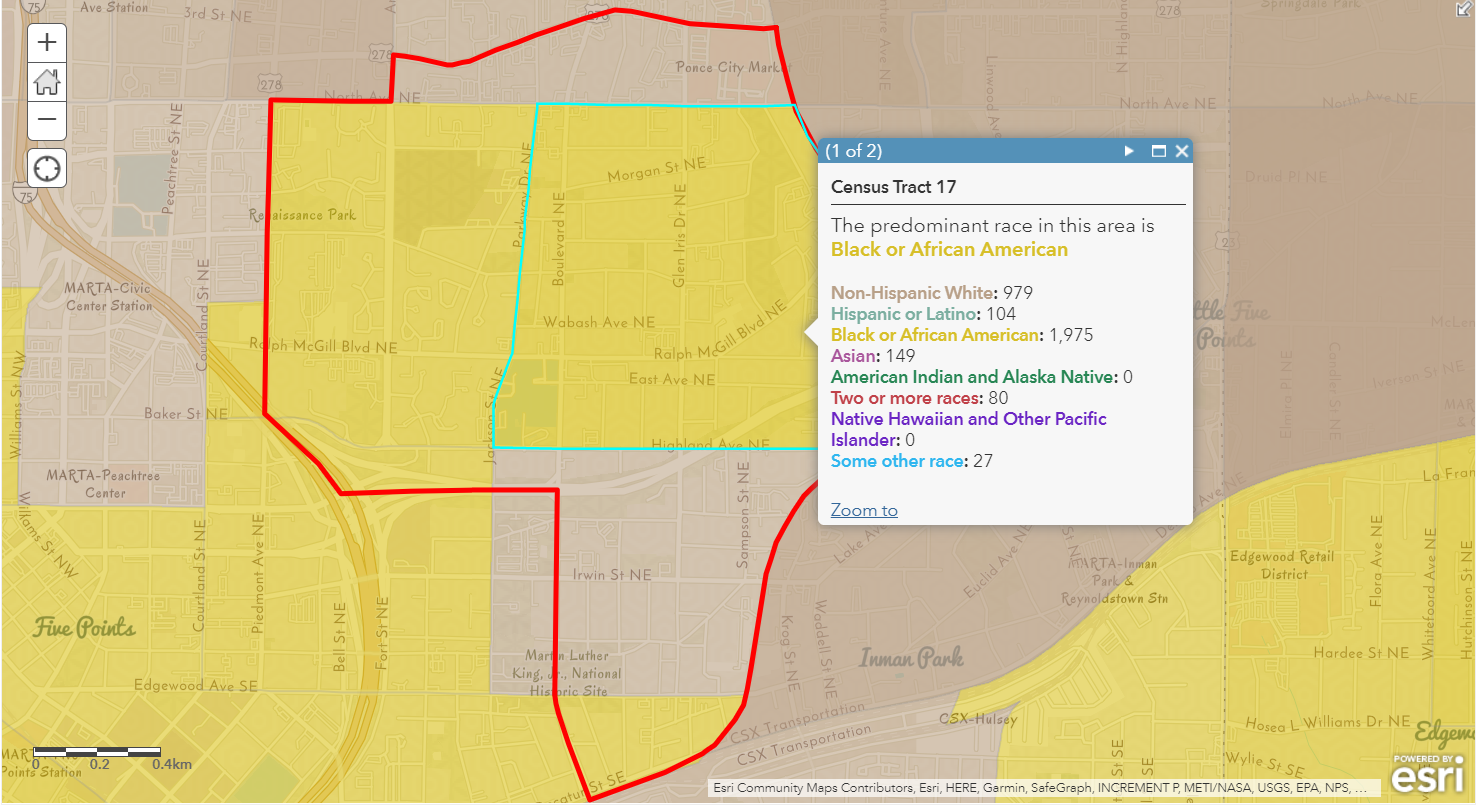
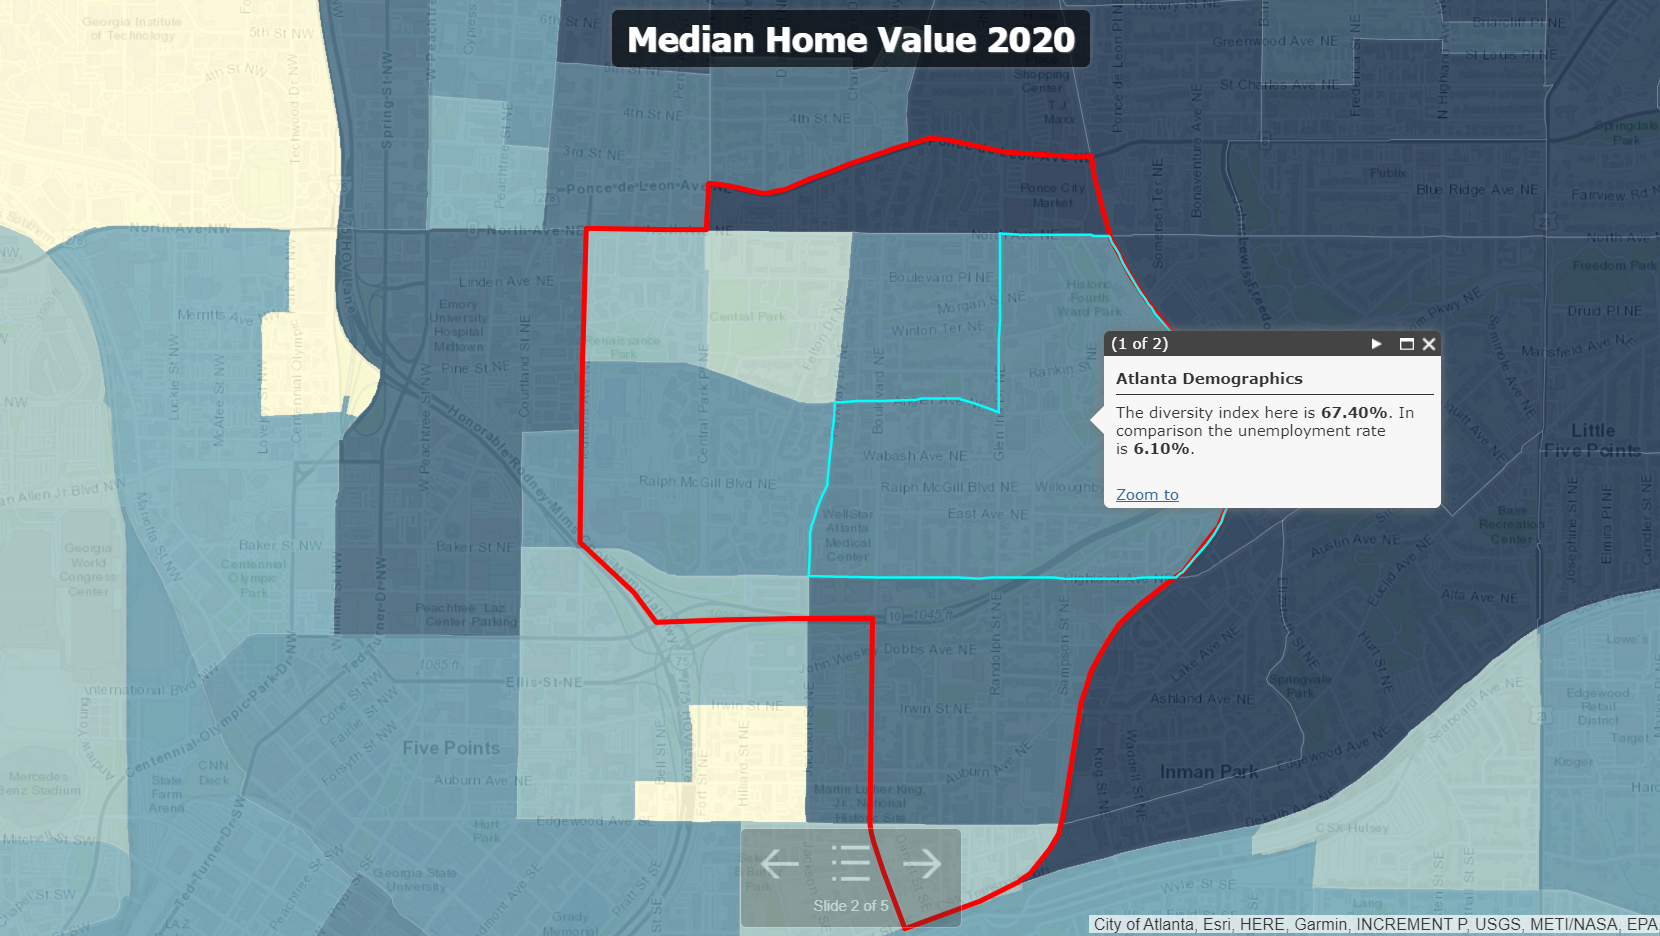
The question they wanted to know was, "Is Old Fourth Ward (O4W) experiencing gentrification?" They found some data on home value and race in two different time frames, before and after 2014. First, they investigated home values and saw there was a change in home values. What was more noticeable was that within the same neighborhood, the home values and income were drastically different. Second, they looked at race. They were able to confirm that the there was a dip in the African American population and a once Black community had changed. Third, they created aseries of map to show their findings. The beauty in this was that it did not have to be perfect. It just had to let them use a beginner’s mind to learn about a problem.